
Introduction Hello and welcome back everyone to our second part of the new blog series [Python for Stock Market Analysis](). In the last part, we explored different [types of moving averages]() like Simple Moving Average (SMA), Exponential Moving Average (EMA), Weighted Moving Average (WMA) and explored other moving metrics like Moving Median and Moving Variance. […]
data analysis

R Exercise: Getting Started With ggplot2 in R
Getting Started with ggplot2 in R Grammar A grammar provides a foundation for understanding different types of graphics. A grammar may also help us on what a well-formed or correct graphic looks like, but there will still be many grammatically correct but nonsensical graphics. This is easy to see by analogy to the English language: […]

Social Network Analysis in R
Social Network Analysis Definition Social networks are simply networks of social interactions and personal relationships. Think about our group of friends and how we got to know them. Maybe we met them while ago from our schooling, or maybe we met them through a hobby or through our community. In fact, 72% of all Internet […]

R Exercise: Training Different ML Models in R
Load Data Dataset is available here. # Loading the data here library(haven) bank_loan_df <- read_sav("P4_bankloan_5000_clients.sav") bank_loan_df$defaulted_loan<-as.factor(bank_loan_df$defaulted_loan) bank_loan_df$education_level<-as.factor(bank_loan_df$education_level) str(bank_loan_df) ## tibble [5,000 x 9] (S3: tbl_df/tbl/data.frame) ## $ age : num [1:5000] 41 30 40 41 57 45 36 39 43 34 … ## ..- attr(*, “label”)= chr “Age in years” ## ..- attr(*, “format.spss”)= chr […]
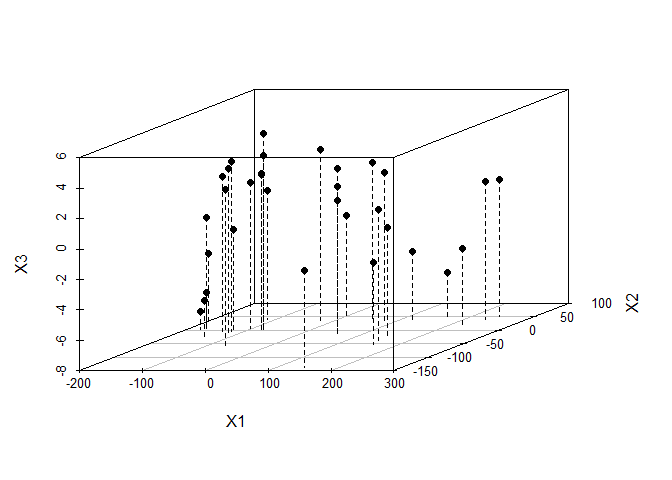
R Exercise: Working with PCA and Dimensionality Reduction
Check the data mtcars with head and save a new data as mtcars.subset after dropping two non-numeric (binary) variables for PCA analysis data <- mtcars head(data) ## mpg cyl disp hp drat wt qsec vs am gear carb ## Mazda RX4 21.0 6 160 110 3.90 2.620 16.46 0 1 4 4 ## Mazda RX4 […]
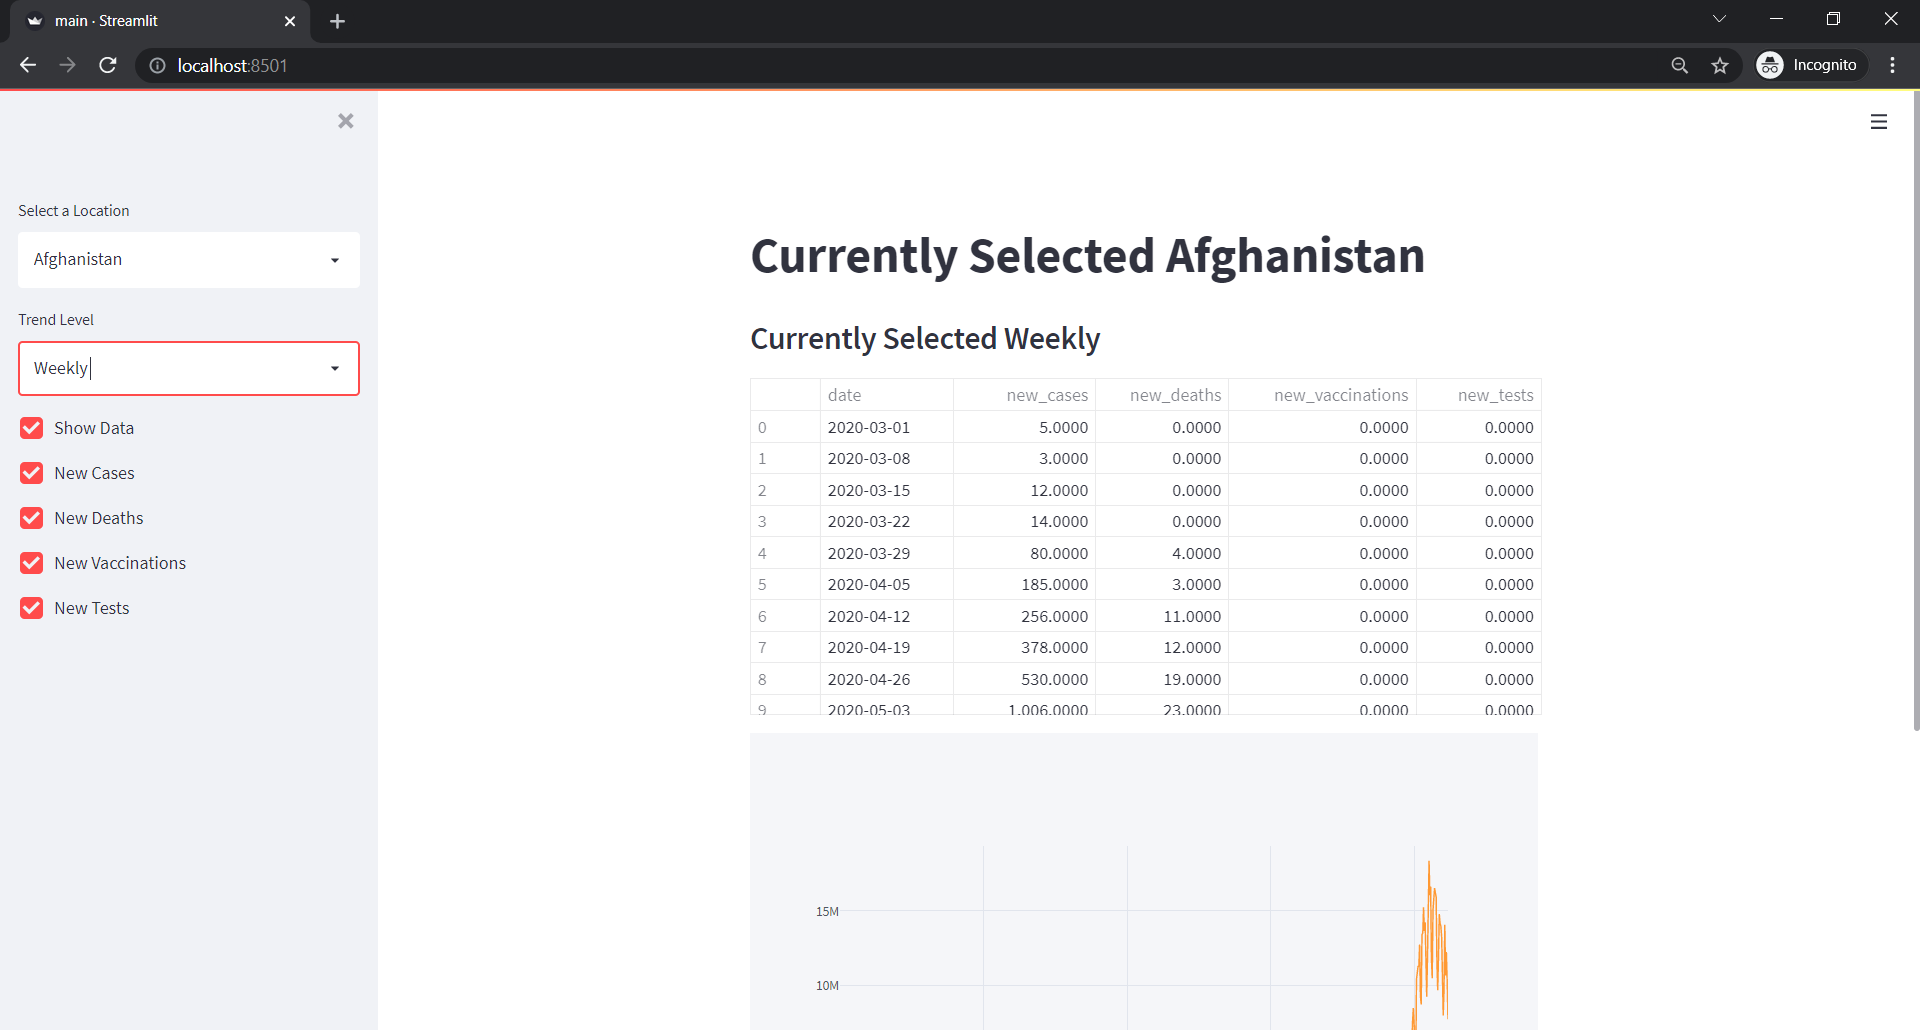
Creating Data Dashboard with Plotly in Streamlit
Data Dashboard are getting highly popular because the need to get insights from data is getting increased. One of the few ways we find the insights from the data is via dashboards. And for Data Analysts, there are options like tableau. But not all of them are for free. However, we can make some cool […]
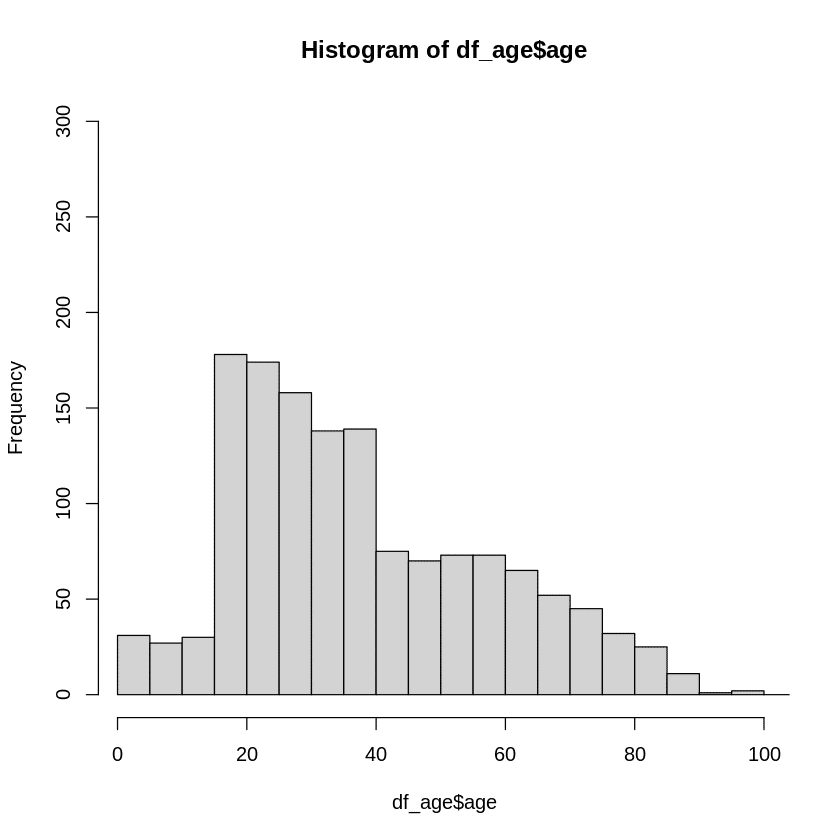
R Exercise: Working with Data from JSON API and Performing EDA
Import any data from JSON API Welcome to our data exploration journey! 🚀 In this exciting venture, we’re harnessing the power of data from the renowned source https://data.askbhunte.com/api/v1/covid. Our toolkit is all set, and we’re armed with two remarkable packages: jsonlite: This versatile gem brings JSON data and R data types together in a harmonious […]

Exploratory Data Analysis in R with Tests
Exploratory Data Analysis in R Hello everyone welcome to our another blog of in R where we will perform various statistical test on Titanic dataset. Code to Read Titanic Dataset data = read.csv("E:/code/Titanic Survival Practice/train.csv") df = data.frame(data) summary(df) PassengerId Survived Pclass Name Min. : 1.0 Min. :0.0000 Min. :1.000 Length:891 1st Qu.:223.5 1st Qu.:0.0000 […]

Getting Started With Dataframe in R
Getting Started With Dataframe in R and Exploring Others Useful Functions Introduction Dataframes are the most commonly used data structures in R. A dataframe is a list in which all components have names and are arranged in rows and columns. The easiest way to understand a dataframe is by visualizing it as a spreadsheet. The […]
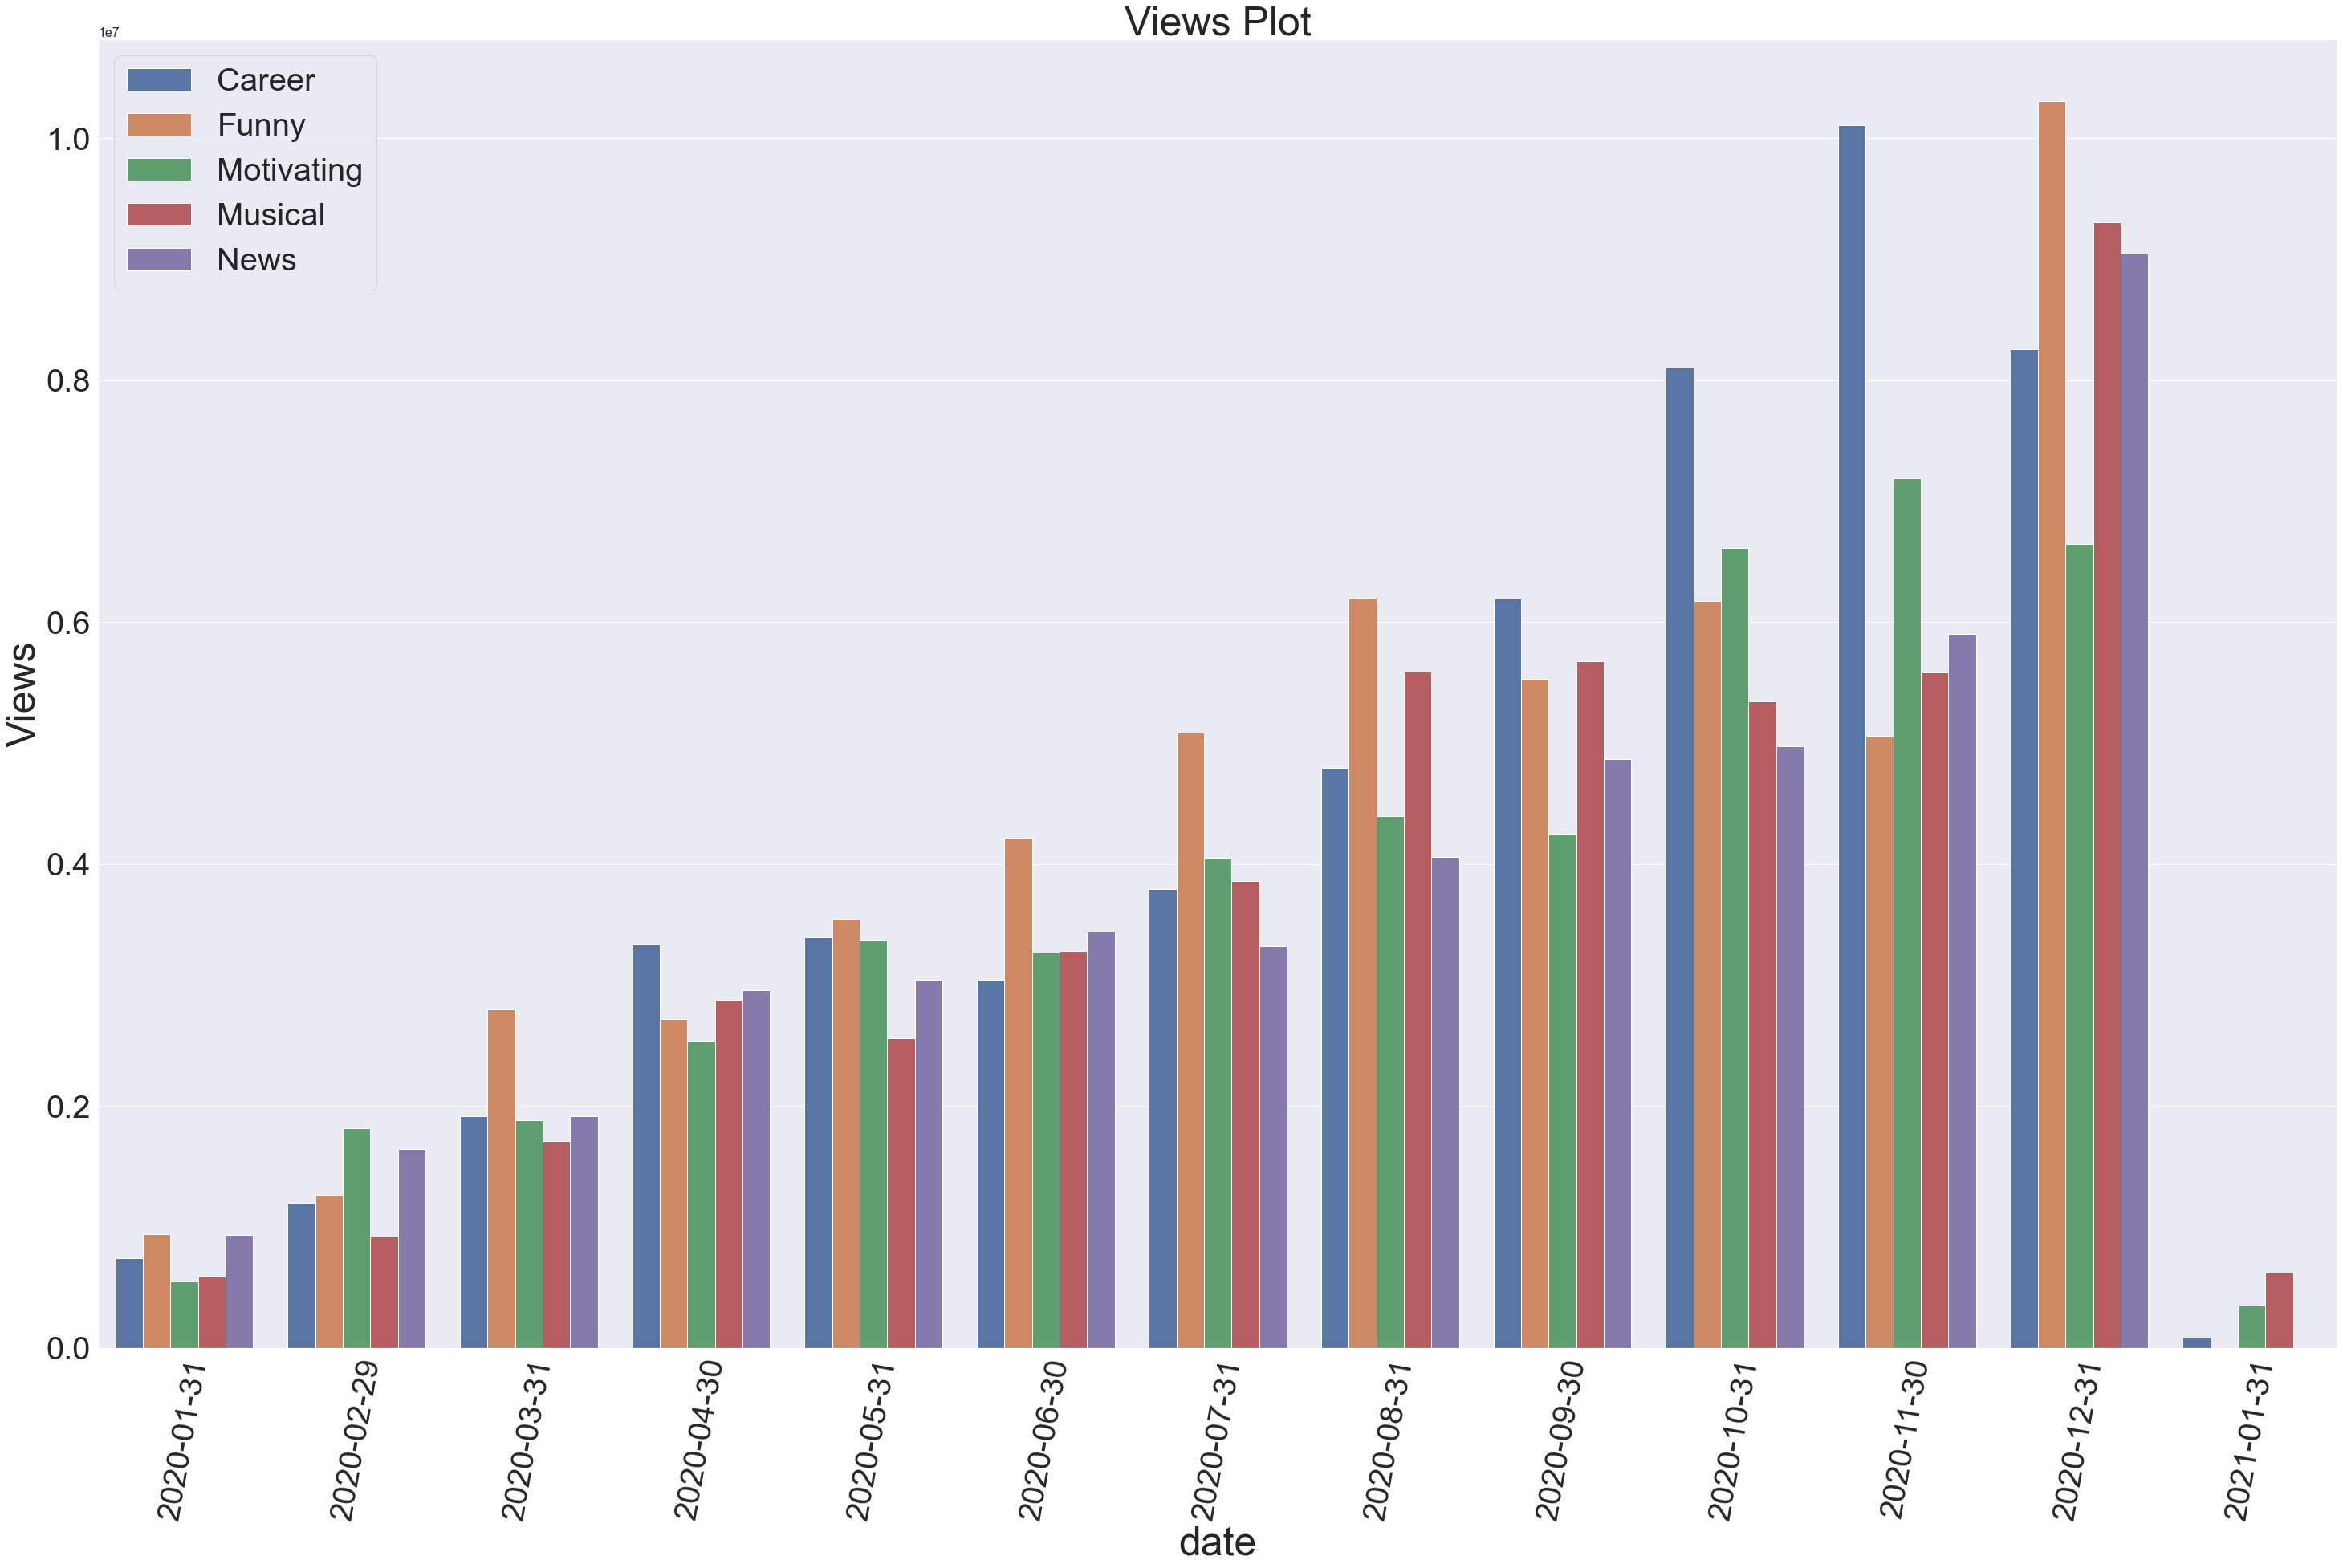
Data Analysis and Importance of Groupby in Pandas but not Just pd.groupby
Data Analysis and Importance of Groupby in Pandas but not Just pd.groupby This blog will be continously updated as I find new ways, tricks to make things work faster and easier. Updates January 5 2022 Started blog and written up to Rate of Views Change Per Month According to Category. What would you like to […]