
EDA: Introduction Hello everyone, welcome back to another new blog where we will explore different ideas and concept one could perform while performing an EDA. In simple words, this blog is a simple walk-through of an average EDA process which might include (in top down order): Data Loading: From various sources (remote, local) and various […]
data analysis

Different Hypothesis Testing Using R
What is Hypothesis Testing It is a type of inferential statistics that involves extrapolating results from a sample (random) to the entire population. It is used to make decisions based on statistical tests and models that use the p-value, also known as the Type I error or alpha error. Type I Error : When we […]

Polynomial Regression Model in R
Polynomial Regression Curve fitting or curve-linear regression are additional words for the same thing. It is used when a scatterplot shows a non-linear relationship. It’s most typically employed with time series data, but it can be applied to a variety of other situations. Let’s use the Nepal Covid data and fit a polynomial models on […]

Nepali News Classification Using Naive Bayes and Decision Tress
Naive Bayes for Nepali News Classification Hello everyone, welcome back to our blog about news classification and in this blog, we are going to explore Naive Bayes for news in our native language Nepali. I started this project nearly a year ago but I never finished it because I did not know anything about it […]

Nepali News Classification Using Logistic Regression
Logistic Regression for Nepali News Classification Hello everyone, and welcome back to my news categorization blog. In this blog, I’ll be looking into Logistic Regression for news in Nepali, which is our native language. I started this project almost a year ago but never finished it because I had no idea what I was doing […]
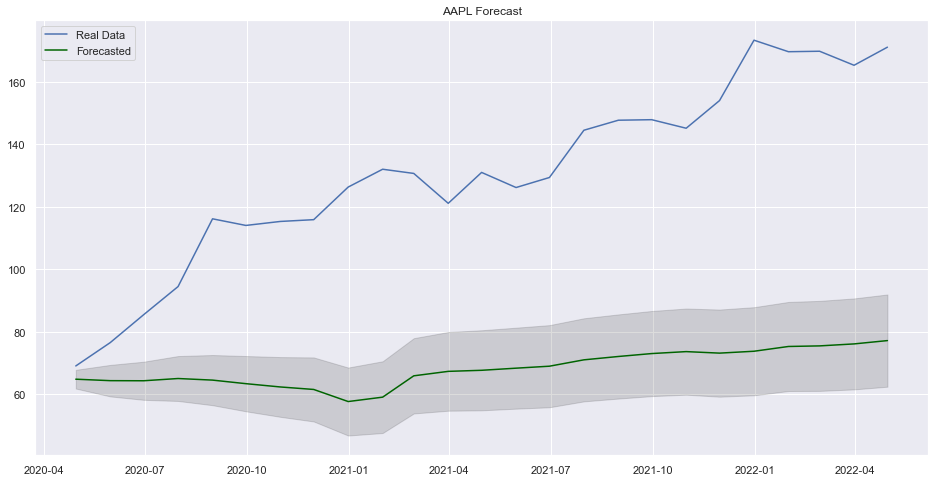
Python for Stock Market Analysis: Getting Started into Modeling Timeseries
Introduction Hello there, this is the part 5 of Python for Stock Market Analysis and in this part, we will continue from where we left i.e. modeling a timeseries. Finding a best set of parameters that gives highly accurate prediction is always a hard job and there is not always a guarantee that one can […]
R Exercise: Validation & Cross-validation for Predictive Modeling
Validation & Cross-validation for Predictive Modeling including Linear Model as well as Multi Linear Model Before starting topic, let’s be familier on some term. Validation : An act of confirming something as true or correct. Also, Validation is the process of establishing documentary evidence that a procedure, process, or activity was carried out in testing […]

Python for Stock Market Analysis: Growth Rates
Introduction Interactive plot version of blog is available at here. This is the part 3 of our Python for Stock Market Analysis series and here, we will explore some of popular growth rates that can be used to see how well is our value is changing over the period of time. Lets take some of […]
Data Analysis Using Pipe Operator in R
Data Analysis Using Pipe Operator in R What is pipe operator? Pipe operators are strong tools for expressing a series of numerous operations in a clear and concise manner. The pipe is a part of the magrittr package. Pipe allows us to write code in a more readable and understandable manner. Lets see how. Why […]
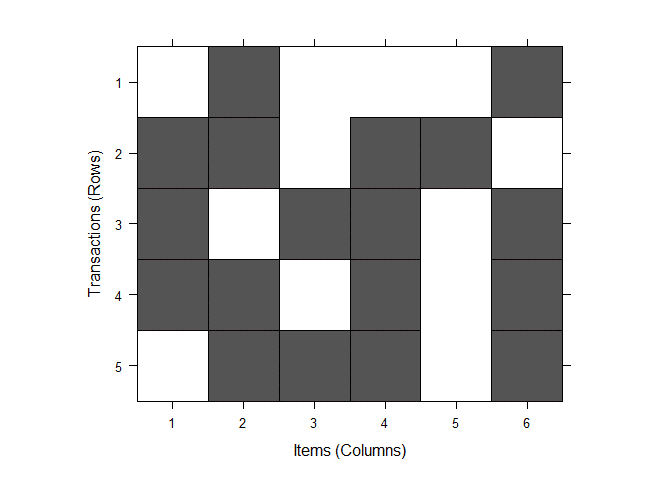
R Exercise: Association Rule Mining in R
Association Rule Mining Association rule mining (also known as Association Rule Learning) is a typical technique for determining relationships (co-occurrence) between many variables. It is mostly used in grocery stores, e-commerce websites, and other similar establishments, in addition to massive transactional databases. Amazon knows what else you want to buy when you order something on […]