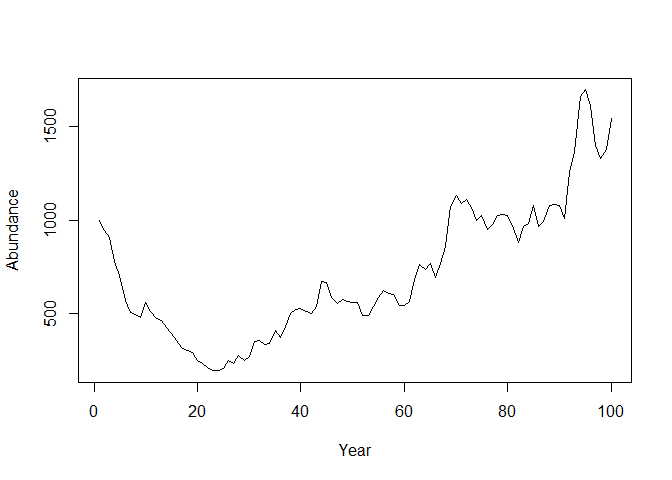
Monte Carlo Simulations What is Monte Carlo Simulations? One of the main motivations to switch from spreadsheet-type tools (such as Microsoft Excel) to a program like R is for simulation modeling. R allows us to repeat the same (potentially complex and detailed) calculations with different random values over and over again. Within the same software, […]
R

Different Hypothesis Testing Using R
What is Hypothesis Testing It is a type of inferential statistics that involves extrapolating results from a sample (random) to the entire population. It is used to make decisions based on statistical tests and models that use the p-value, also known as the Type I error or alpha error. Type I Error : When we […]

Polynomial Regression Model in R
Polynomial Regression Curve fitting or curve-linear regression are additional words for the same thing. It is used when a scatterplot shows a non-linear relationship. It’s most typically employed with time series data, but it can be applied to a variety of other situations. Let’s use the Nepal Covid data and fit a polynomial models on […]
R Exercise: Validation & Cross-validation for Predictive Modeling
Validation & Cross-validation for Predictive Modeling including Linear Model as well as Multi Linear Model Before starting topic, let’s be familier on some term. Validation : An act of confirming something as true or correct. Also, Validation is the process of establishing documentary evidence that a procedure, process, or activity was carried out in testing […]
Data Analysis Using Pipe Operator in R
Data Analysis Using Pipe Operator in R What is pipe operator? Pipe operators are strong tools for expressing a series of numerous operations in a clear and concise manner. The pipe is a part of the magrittr package. Pipe allows us to write code in a more readable and understandable manner. Lets see how. Why […]
R Exercise: Association Rule Mining in R
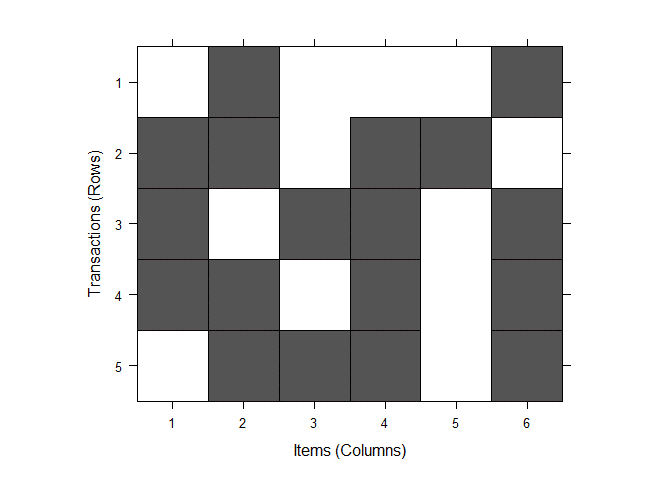
Association Rule Mining Association rule mining (also known as Association Rule Learning) is a typical technique for determining relationships (co-occurrence) between many variables. It is mostly used in grocery stores, e-commerce websites, and other similar establishments, in addition to massive transactional databases. Amazon knows what else you want to buy when you order something on […]

R Exercise: Getting Started With ggplot2 in R
Getting Started with ggplot2 in R Grammar A grammar provides a foundation for understanding different types of graphics. A grammar may also help us on what a well-formed or correct graphic looks like, but there will still be many grammatically correct but nonsensical graphics. This is easy to see by analogy to the English language: […]

Social Network Analysis in R
Social Network Analysis Definition Social networks are simply networks of social interactions and personal relationships. Think about our group of friends and how we got to know them. Maybe we met them while ago from our schooling, or maybe we met them through a hobby or through our community. In fact, 72% of all Internet […]

R Exercise: Training Different ML Models in R
Load Data Dataset is available here. # Loading the data here library(haven) bank_loan_df <- read_sav("P4_bankloan_5000_clients.sav") bank_loan_df$defaulted_loan<-as.factor(bank_loan_df$defaulted_loan) bank_loan_df$education_level<-as.factor(bank_loan_df$education_level) str(bank_loan_df) ## tibble [5,000 x 9] (S3: tbl_df/tbl/data.frame) ## $ age : num [1:5000] 41 30 40 41 57 45 36 39 43 34 … ## ..- attr(*, “label”)= chr “Age in years” ## ..- attr(*, “format.spss”)= chr […]

R Exercise: Working with Outliers and Fitting Different Machine Learning Models
Extract the Nepal COVID-19 data from Wikipedia to fit the following models with daily deaths as dependent variable and time as independent variable First plot the daily deaths by time and distribute the three outliers (added deaths around timeline of 400) before fitting the following models in the outlier adjusted data on training and testing […]