
K Medoids Clustering is a clustering algorithm, have you tried to write it from scratch in Python? But before that, if you are also looking for other algorithms from scratch then please follow along: Linear Regression from Scratch Logistic Regression from Scratch Logistic Regression with Different Loss Functions PCA from Scratch K-Means Clustering from Scratch […]
Machine Learning
Plotting Interactive plots with Plotly and Cufflinks
Plotting High Quality Plots in Python with Plotly and Clufflinks Interactive Plot This blog contains static images and is not rendering interactive plots thus we request you to visit this interactive blog. Introduction Hello everyone, in this blog we are going to explore some of most used and simplest plots in the data analysis. If […]
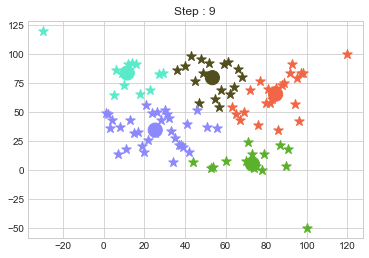
K means Clustering in Python from Scratch
K means Clustering in Python from Scratch Introduction K means clustering is very simple type of unsupervised learning. Which is used to solve clustering problem. Using this algorithm we can easily classify given data point in given numbers of clusters (k). To do so we should first find number of cluster. In k mean cluster […]

Exploratory Data Analysis in R with Tests
Exploratory Data Analysis in R Hello everyone welcome to our another blog of in R where we will perform various statistical test on Titanic dataset. Code to Read Titanic Dataset data = read.csv("E:/code/Titanic Survival Practice/train.csv") df = data.frame(data) summary(df) PassengerId Survived Pclass Name Min. : 1.0 Min. :0.0000 Min. :1.000 Length:891 1st Qu.:223.5 1st Qu.:0.0000 […]

Getting Started With Dataframe in R
Getting Started With Dataframe in R and Exploring Others Useful Functions Introduction Dataframes are the most commonly used data structures in R. A dataframe is a list in which all components have names and are arranged in rows and columns. The easiest way to understand a dataframe is by visualizing it as a spreadsheet. The […]
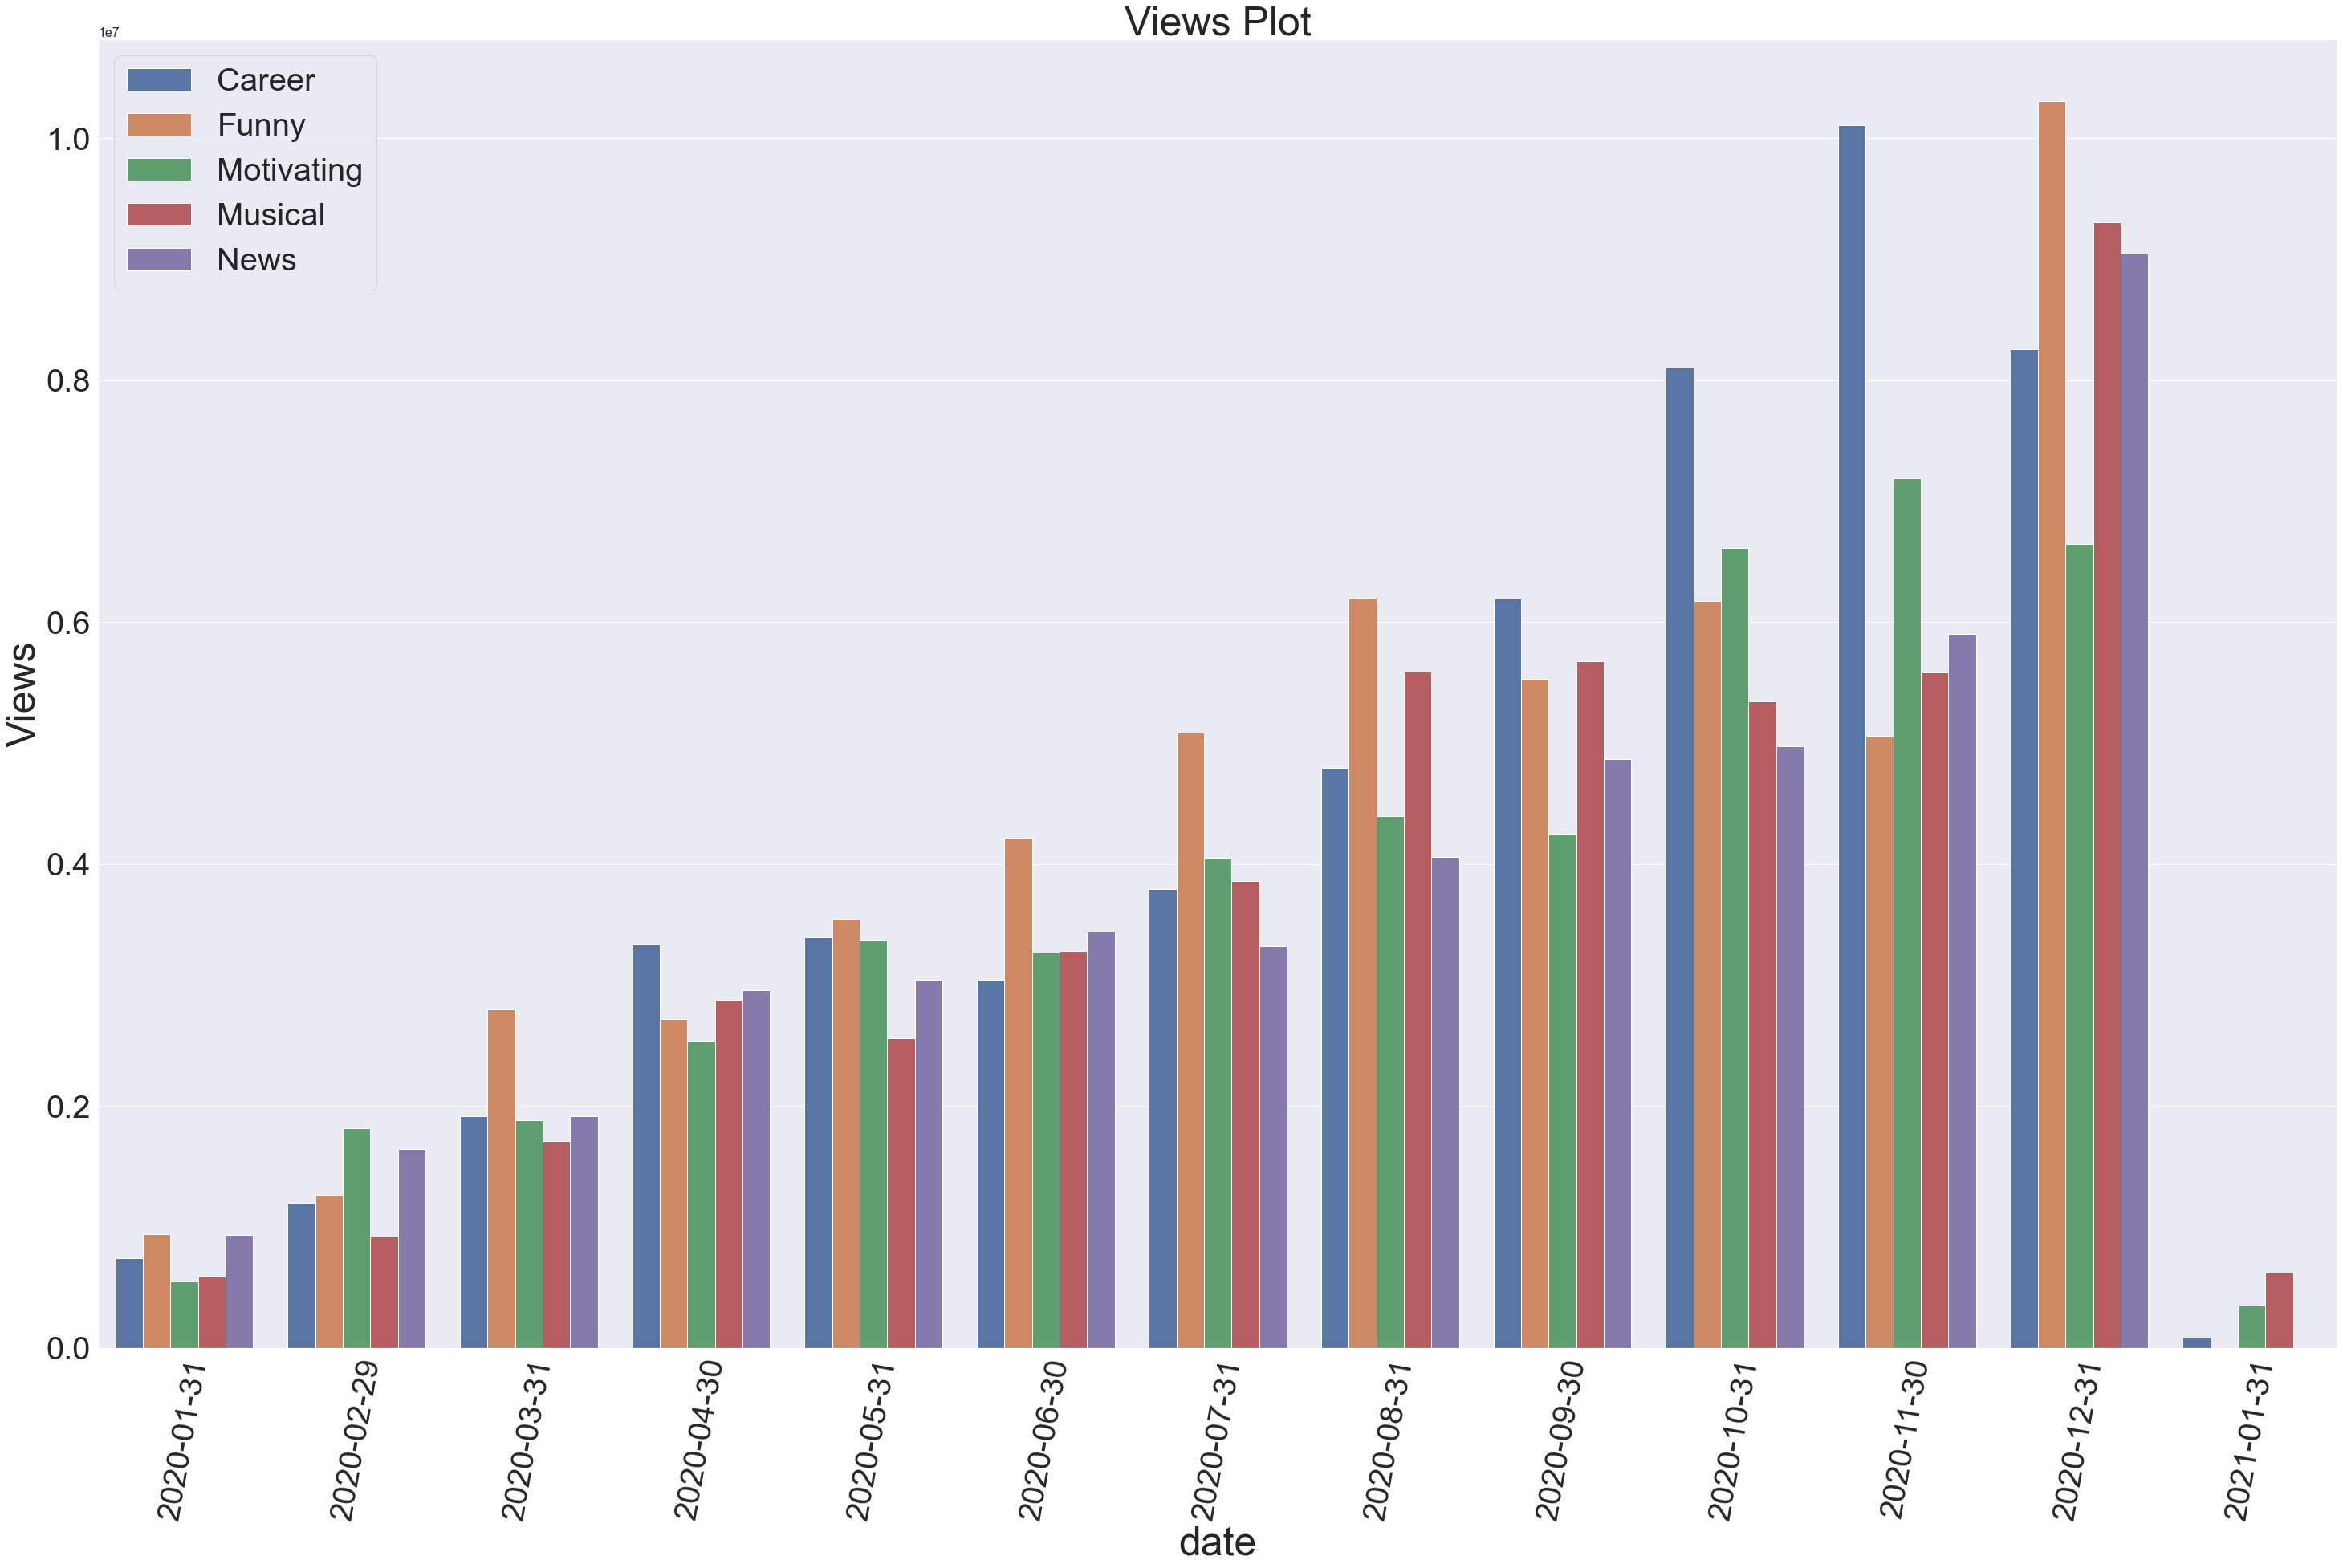
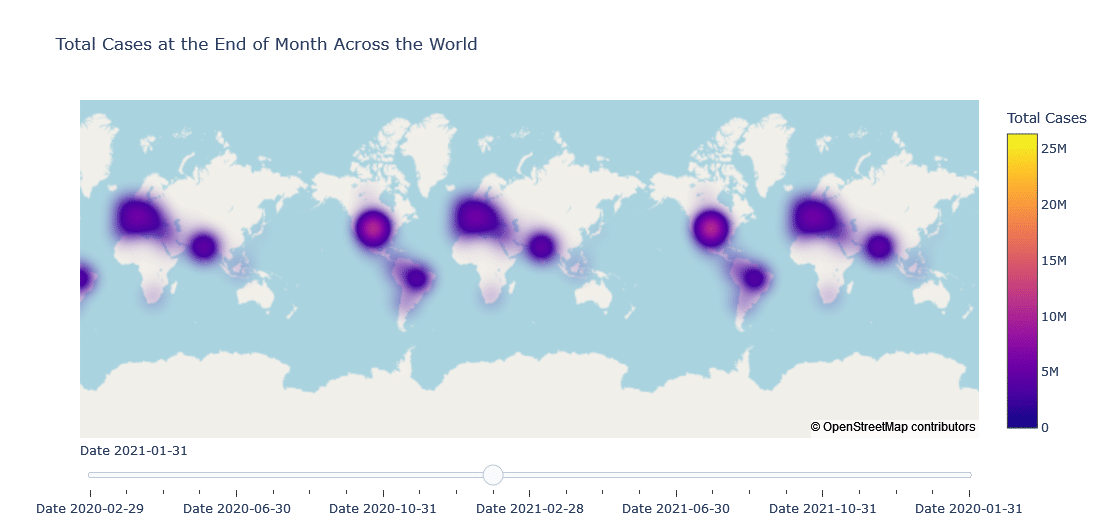
Data Analysis and Importance of Groupby in Pandas but not Just pd.groupby
Data Analysis and Importance of Groupby in Pandas but not Just pd.groupby This blog will be continously updated as I find new ways, tricks to make things work faster and easier. Updates January 5 2022 Started blog and written up to Rate of Views Change Per Month According to Category. What would you like to […]
T-Test for Statistics and Brief Introduction in R
t- test History About Student t- Distribution t-static: t-static was first discovered by Englishman W.S Gosset with his nick name student who published it in 1908 in his research paper entitled " The probable error of the sample mean". Therefore, this t-statistic is called student’s t-statics. Later on Prof. R.A Fisher developed and defined the […]
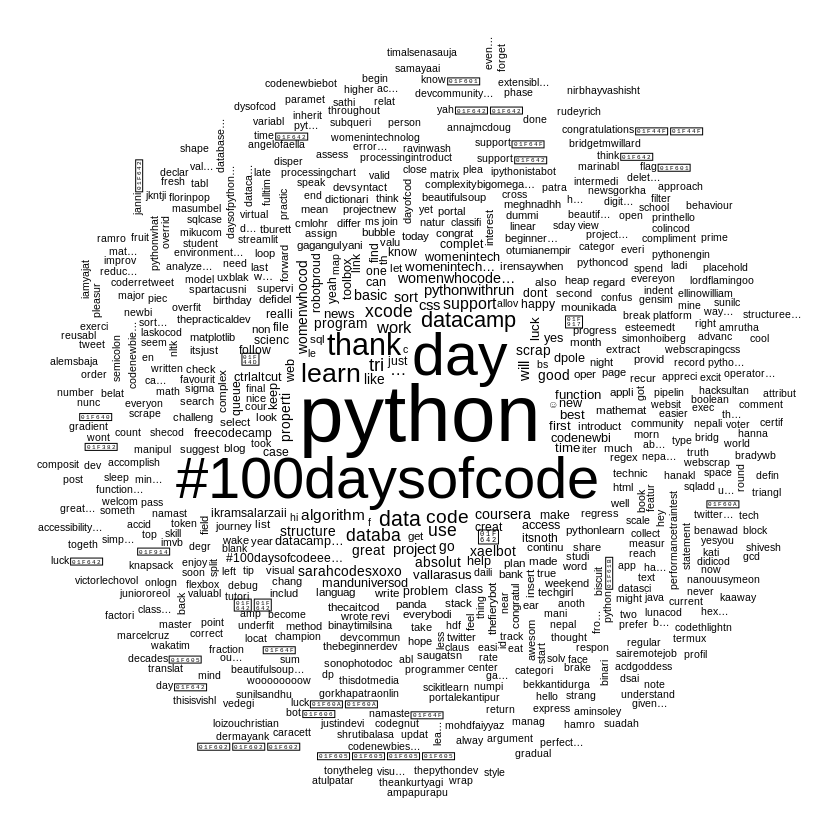
Text Mining and its Importance in NLP, ML and AI
Text Mining and its Importance in NLP, ML and AI Introduction to Text Data According to IBM Article, Text mining, also known as text data mining, is the process of transforming unstructured text into a structured format to identify meaningful patterns and new insights. Text is a common type of data floating around our world […]
Getting Started with R Programming Language
Getting Started With R . Introduction R is a programming language and software environment for statistical computing and graphics supported by the R Foundation. Unlike general-purpose programming languages like Java and C, R was created by statisticians as an interactive environment. Interactivity is a critical characteristic that allows R to explore data effectively. It serves […]
Gesture Based Calculator
Gesture Based Calculator Hello and welcome everyone to our last project on the #7DaysOfComputerVisionProjects series where we did some cool computer vision projects using image processing and opensource tools. Here in this project, we will build a calculator and we will control it by moving our fingers in front of the camera. We will make […]