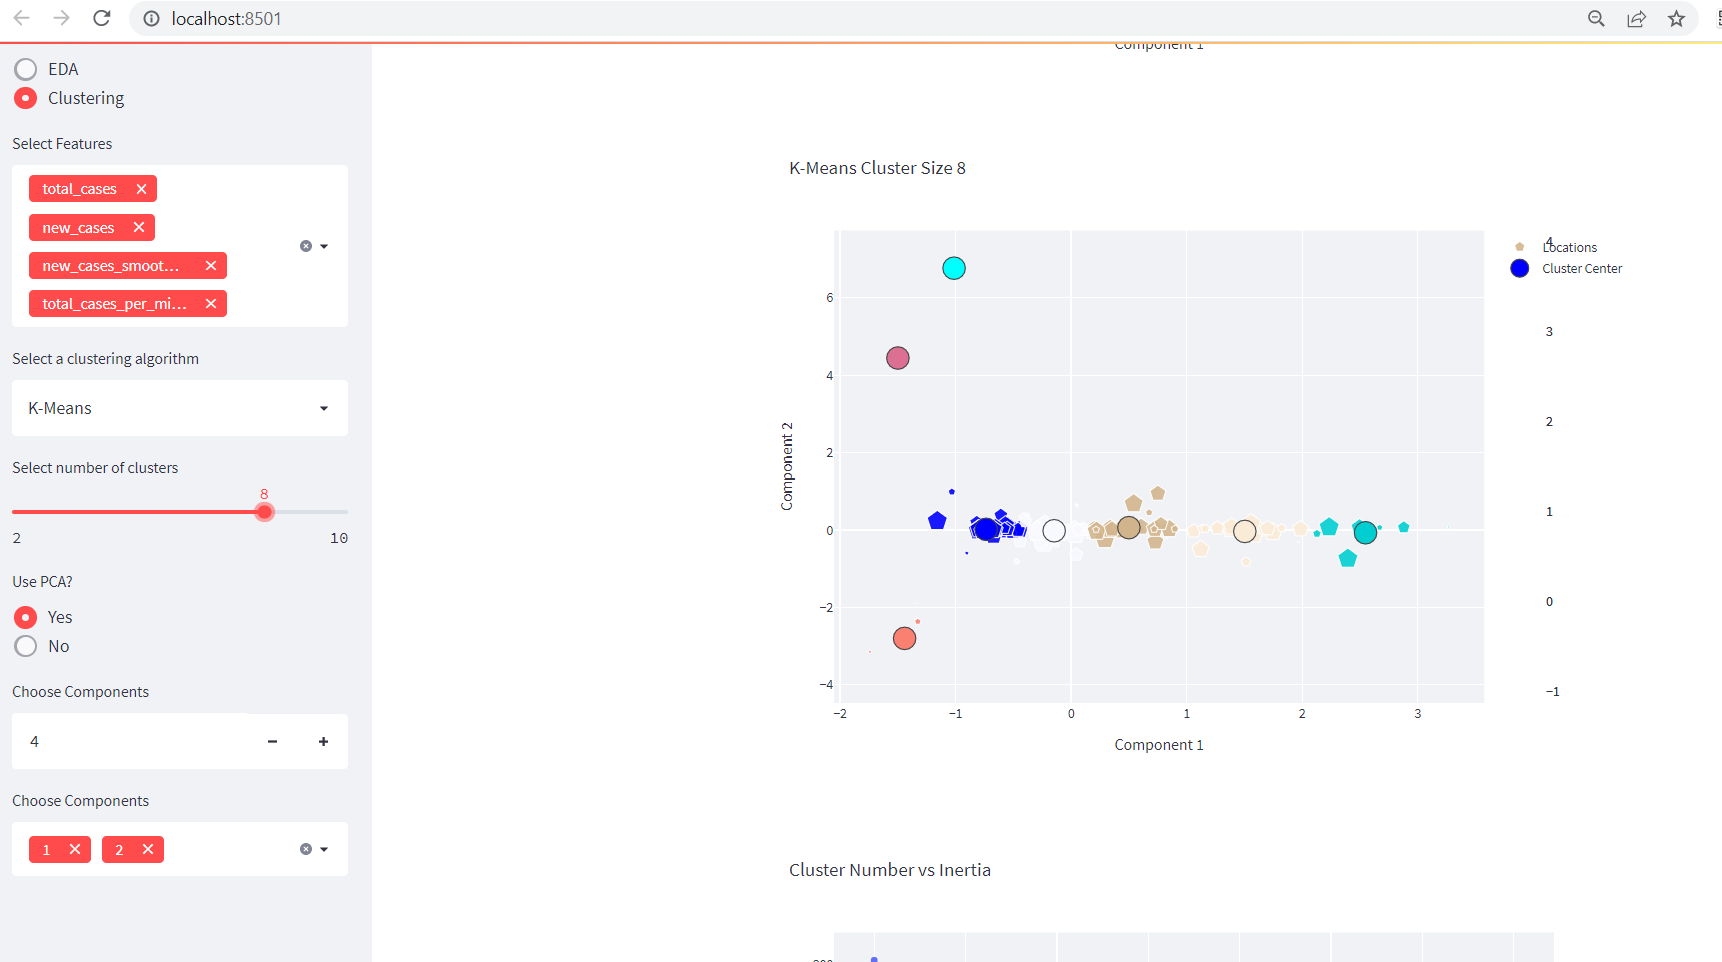
This is a continuation of our previous blog entitled as Creating Data Dashboards With Streamlit and Python. Adding A Clustering Functionality Before diving into the clustering functionality in our existing app, please make sure you are following previous part. Or you can grab all the codes from below: import streamlit as st import numpy as […]
kmeans
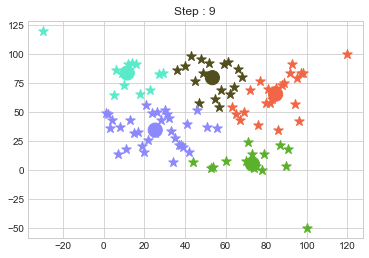
K means Clustering in Python from Scratch
K means Clustering in Python from Scratch Introduction K means clustering is very simple type of unsupervised learning. Which is used to solve clustering problem. Using this algorithm we can easily classify given data point in given numbers of clusters (k). To do so we should first find number of cluster. In k mean cluster […]