
EDA on News Data Hello everyone, in this blog, we are going to perform EDA on Nepali News data that I scraped back in 2021. EDA is the basic step done in any Data Science project and here, we are going to perform simple analysis like counts of title, words and news in category. Import […]
Month: April 2022
Introduction to Probability for Data Science: Getting Started
Introduction Hello there welcome to the new blog series about Probability in the Data Science field. Here in this blog, we will start from basic concepts needed in using Probability in some datasets. This blog is going to be very short and basic yet informative. Probability is all about measurement of some event’s occurrence. We […]

Linear Regression Using Different Gradient Descent
Gradient Descent Gradient Descent is the most popular optimizer to update parameters and it uses the gradient of the error with respect to the parameter. But the parameter update rule is different and thus there are different variants of Gradient Descent. Mini- Batch Gradient Decent It is the simplest algorithm, where we update parameters in […]
Python for Stock Market Analysis: Getting Started into Modeling Timeseries
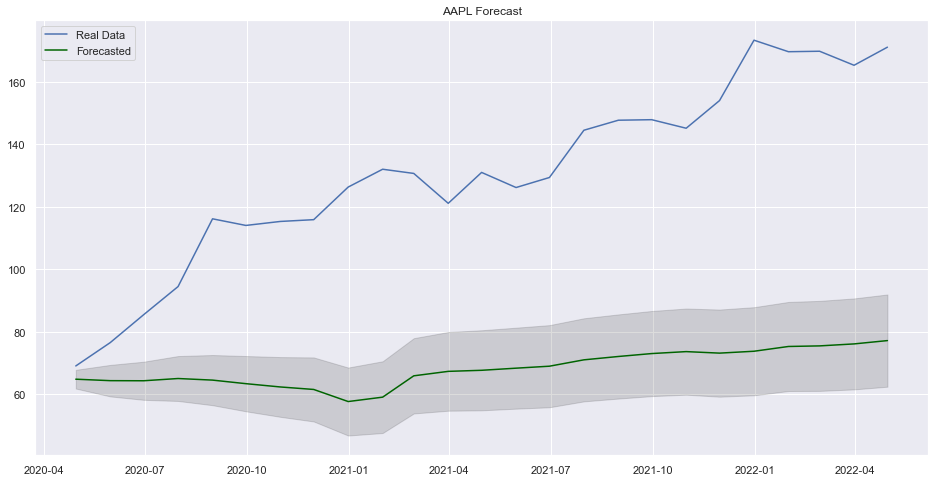
Introduction Hello there, this is the part 5 of Python for Stock Market Analysis and in this part, we will continue from where we left i.e. modeling a timeseries. Finding a best set of parameters that gives highly accurate prediction is always a hard job and there is not always a guarantee that one can […]

Logistic Regression from Scratch in Python: Exploring MSE and Log Loss
Logistic Regression From Scratch Hello everyone, here in this blog we will explore how we could train a logistic regression from scratch. We will start from mathematics and gradually implement small chunks into our code. Import Necessary Module pandas : Working for DataFrame numpy : For array operation matplotlib : For visualization time : function […]
Python for Stock Market Analysis: Getting Started into Timeseries Analysis
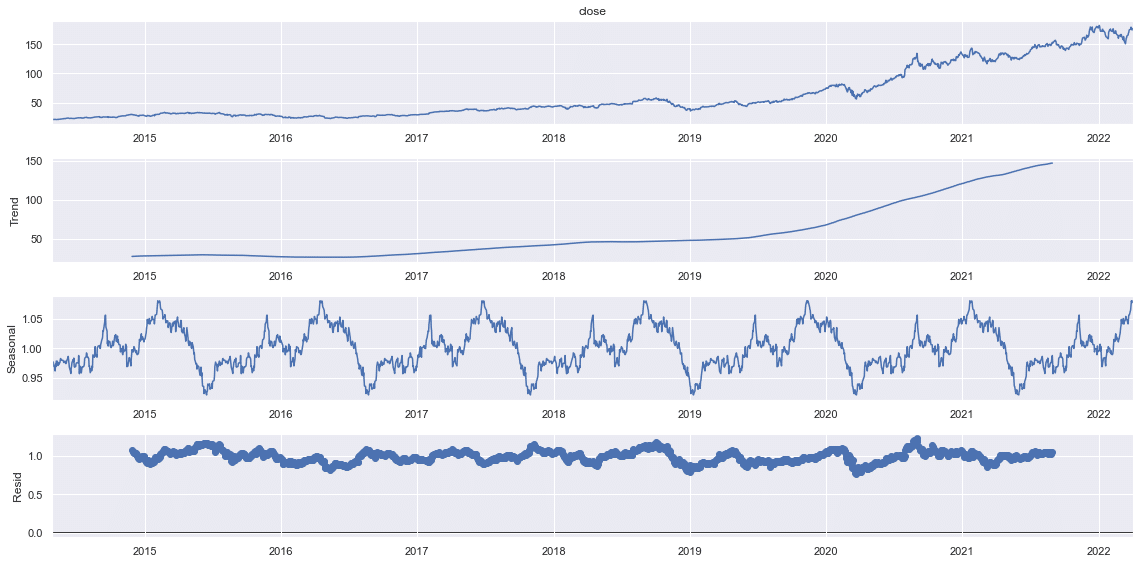
Introduction This is the part 4 of our Python for Stock Market Analysis series and here, we will be getting started with timeseries analysis. This part will not be exploring any prediction techniques yet as we will explore fundamental concepts in timeseries. Making Things Ready Here, we will import Pandas for data analysis, install as […]
R Exercise: Validation & Cross-validation for Predictive Modeling
Validation & Cross-validation for Predictive Modeling including Linear Model as well as Multi Linear Model Before starting topic, let’s be familier on some term. Validation : An act of confirming something as true or correct. Also, Validation is the process of establishing documentary evidence that a procedure, process, or activity was carried out in testing […]

Python for Stock Market Analysis: Growth Rates
Introduction Interactive plot version of blog is available at here. This is the part 3 of our Python for Stock Market Analysis series and here, we will explore some of popular growth rates that can be used to see how well is our value is changing over the period of time. Lets take some of […]

Data Analysis Using Pipe Operator in R
Data Analysis Using Pipe Operator in R What is pipe operator? Pipe operators are strong tools for expressing a series of numerous operations in a clear and concise manner. The pipe is a part of the magrittr package. Pipe allows us to write code in a more readable and understandable manner. Lets see how. Why […]