
Exploratory Data Analysis in R Hello everyone welcome to our another blog of in R where we will perform various statistical test on Titanic dataset. Code to Read Titanic Dataset data = read.csv("E:/code/Titanic Survival Practice/train.csv") df = data.frame(data) summary(df) PassengerId Survived Pclass Name Min. : 1.0 Min. :0.0000 Min. :1.000 Length:891 1st Qu.:223.5 1st Qu.:0.0000 […]
Data Analysis
Something about Data Analysis.

Getting Started With Dataframe in R
Getting Started With Dataframe in R and Exploring Others Useful Functions Introduction Dataframes are the most commonly used data structures in R. A dataframe is a list in which all components have names and are arranged in rows and columns. The easiest way to understand a dataframe is by visualizing it as a spreadsheet. The […]
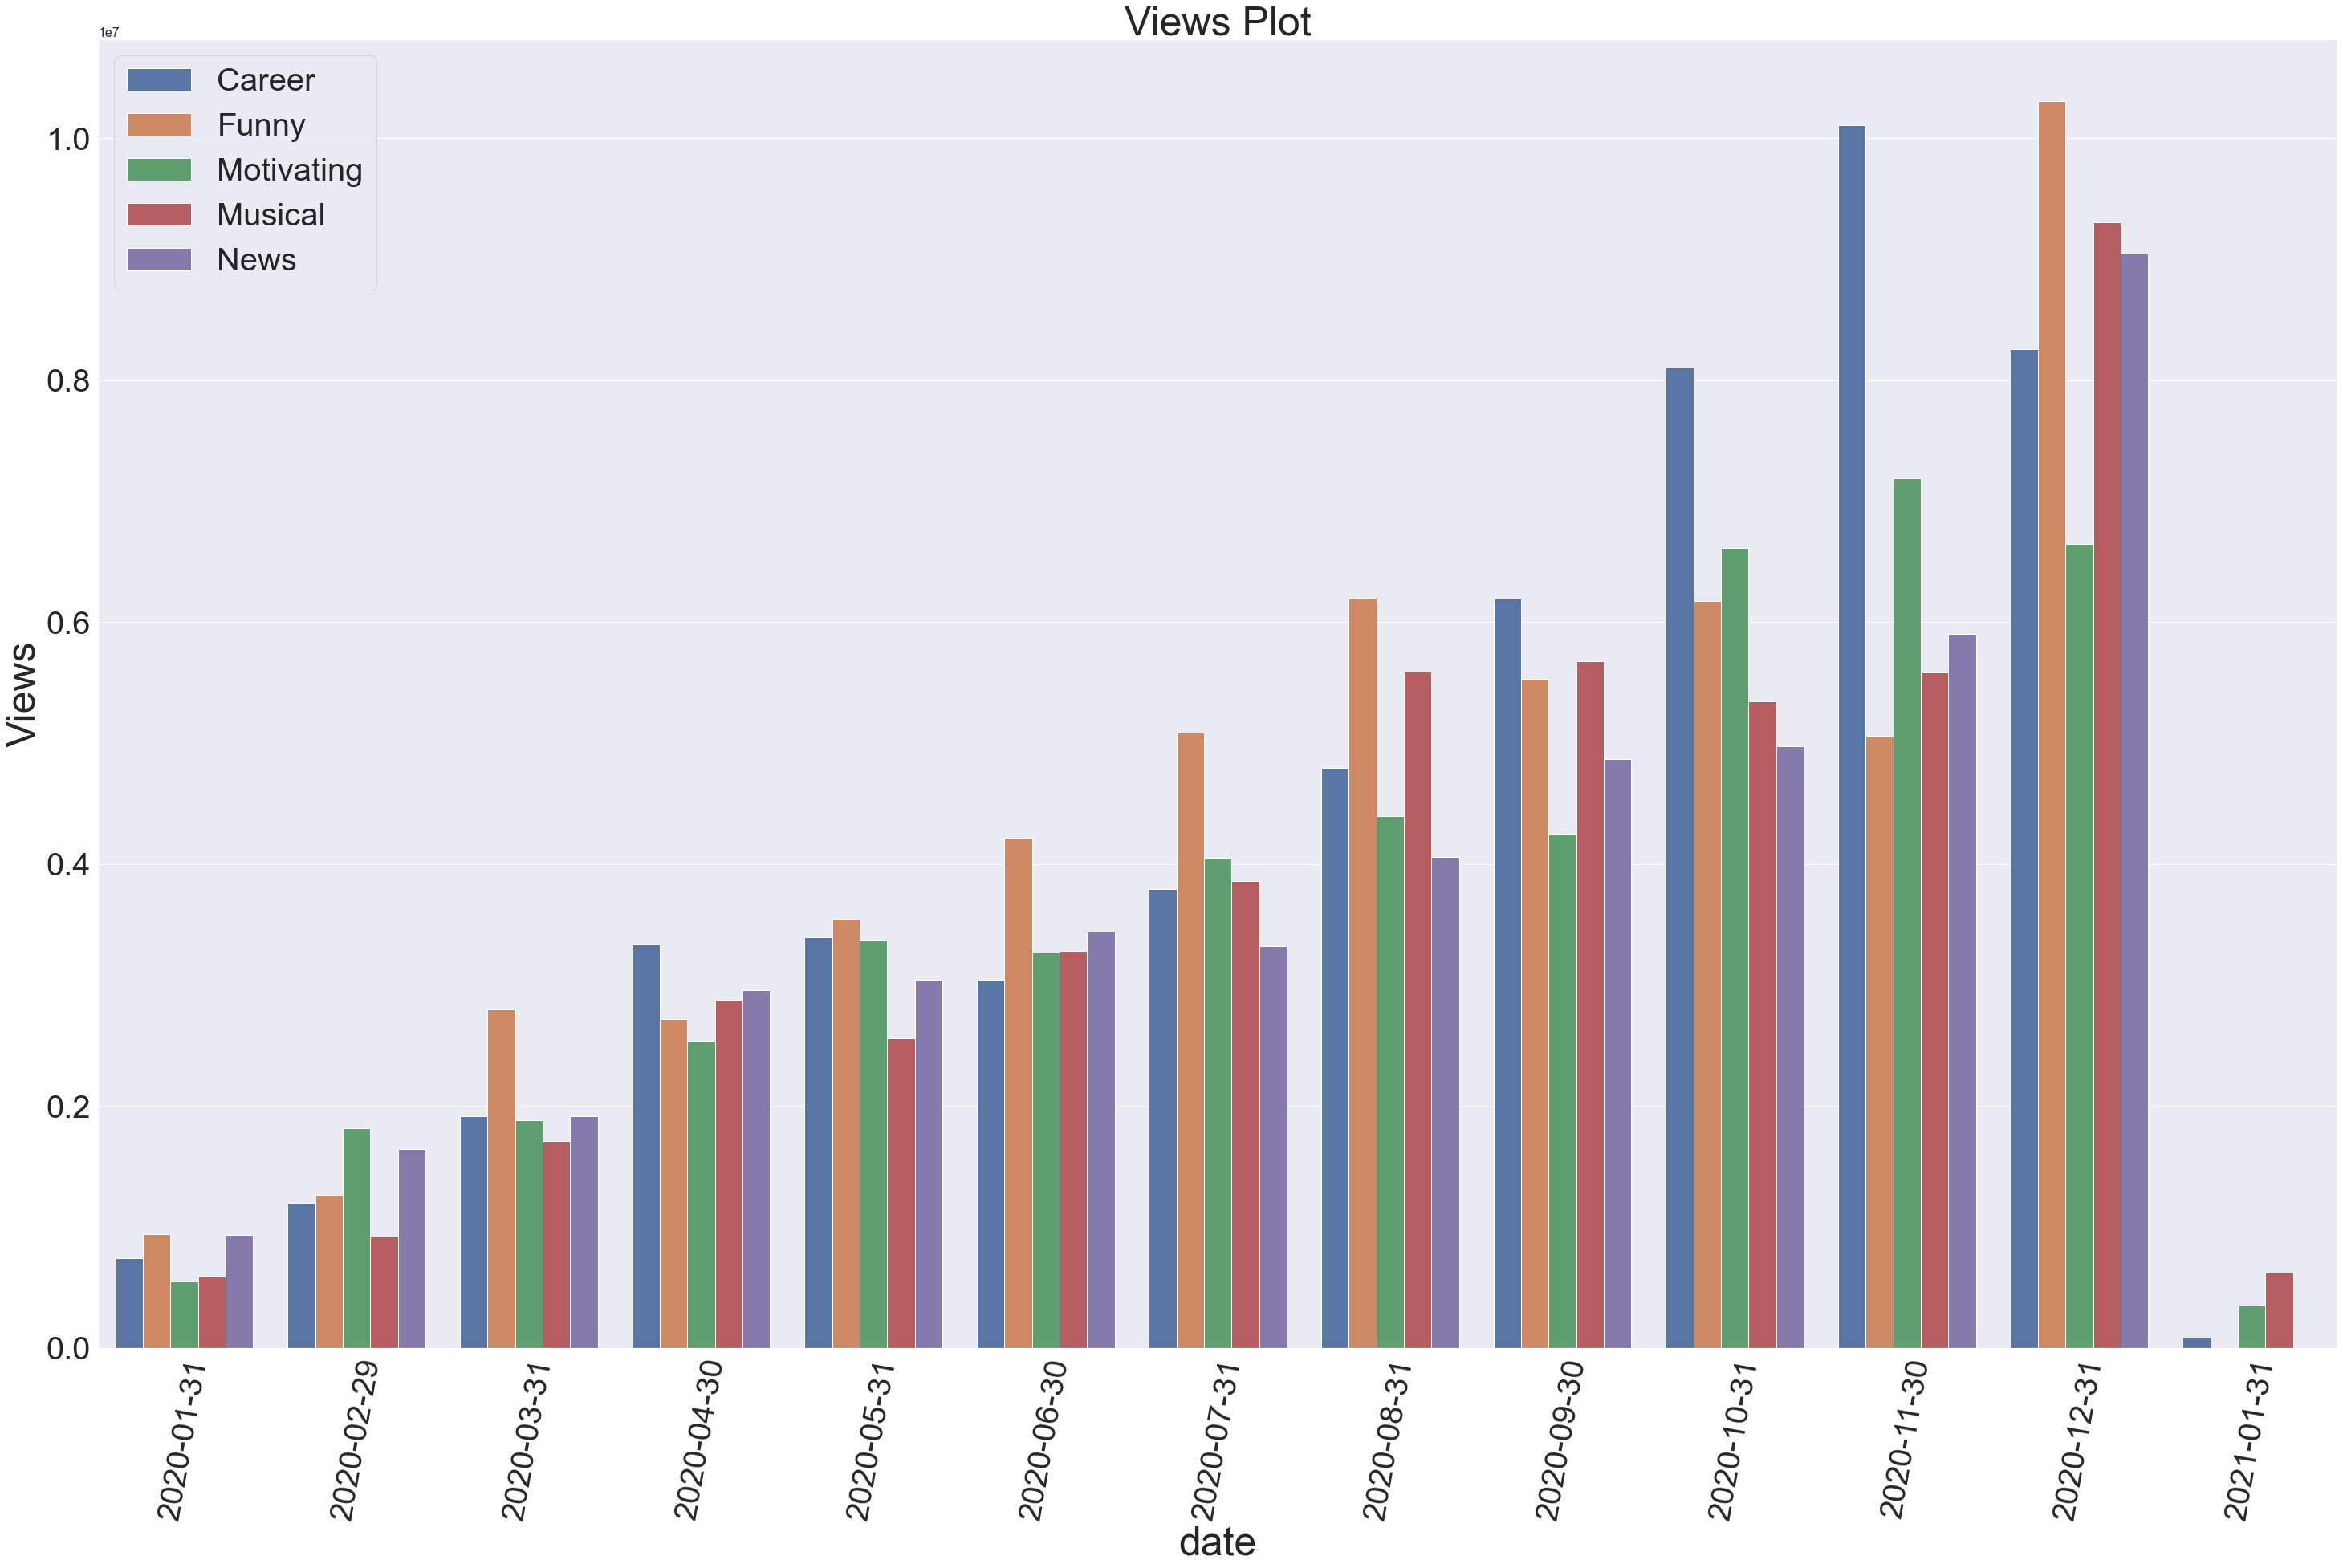
Data Analysis and Importance of Groupby in Pandas but not Just pd.groupby
Data Analysis and Importance of Groupby in Pandas but not Just pd.groupby This blog will be continously updated as I find new ways, tricks to make things work faster and easier. Updates January 5 2022 Started blog and written up to Rate of Views Change Per Month According to Category. What would you like to […]
Getting Started with R Programming Language
Getting Started With R . Introduction R is a programming language and software environment for statistical computing and graphics supported by the R Foundation. Unlike general-purpose programming languages like Java and C, R was created by statisticians as an interactive environment. Interactivity is a critical characteristic that allows R to explore data effectively. It serves […]

NEPSE (Nepal Stock Exchange) Data Visualizing and Deploy it on Heroku
Introduction Visualize Nepal Stock Exchange Data and Deploy it On Heroku Using Streamlit and Plotly. If you are from Nepal then you already know what Nepal Stock Exchange means. Honestly I don’t know how to describe stock market but after watching movie Pi, I wanted to take a look at NEPSE data by myself. I […]